In March, we launched online advertising for Osiedle Głosków, a residential home development by BG Development II Sp. z o.o. in Poland, near Warsaw.
Because this project is located near Warsaw, the goal was never to generate empty website traffic.
The goal was much more important than that.
We wanted to reach people who were genuinely considering buying a home in this area, then move them toward inquiry, conversation, and ultimately, a sale.
After just one month, the campaign was already showing clear traction.
The website recorded 2,700 visits.
We generated 32 leads.
Most importantly, the campaign contributed to the sale of 1 home.
The March report also showed 57,905 ad impressions, 2,823 visits from ads, an average cost per click of about $0.20, and a total ad spend of approximately $562.50. Part of the planned budget was not spent because the payment card hit its limit.
Starting Point: First, We Needed to Create Real Traffic
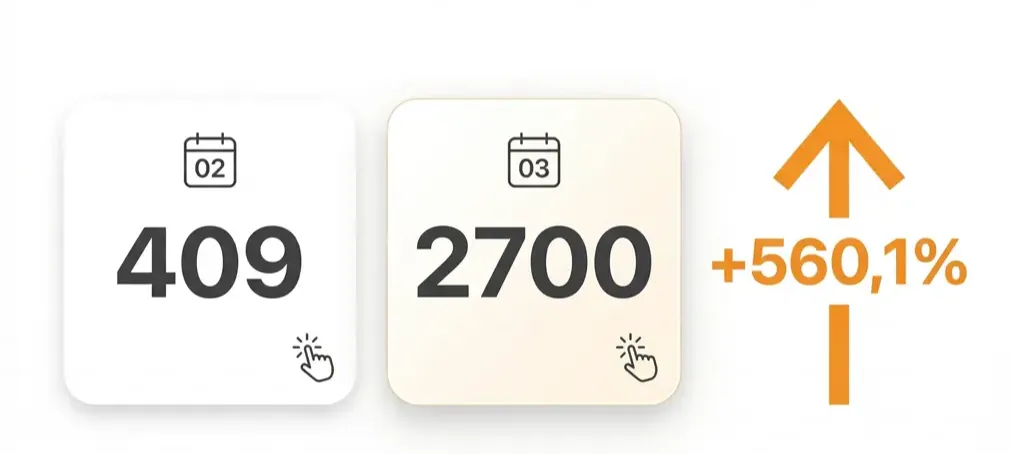
Before the campaign launched, the development website was receiving 409 monthly visits.
After going live in March, traffic increased to 2,700 visits.
That represents a traffic increase of roughly 560.1% in the very first month.
This matters because when you are selling homes, simply having a website is not enough.
Even a well designed website will not generate sales on its own if qualified buyers are not reaching it.
First, you need to create a steady flow of the right visitors.
Only then can you realistically talk about leads, sales conversations, and closed deals.
This Was Never About Clicks. It Was About Buyers
The purpose of this campaign was not to inflate vanity metrics.
We were not interested in impressions for the sake of impressions.
We were not trying to generate traffic just to say the numbers looked good.
Our job was to attract people who were seriously considering buying a home, then guide them through the next stages of the buying decision.
That is exactly why this campaign was built around business outcomes.
Not traffic for traffic’s sake.
Not random visits.
Only qualified leads and real sales.
Our Proprietary Hot Demand System
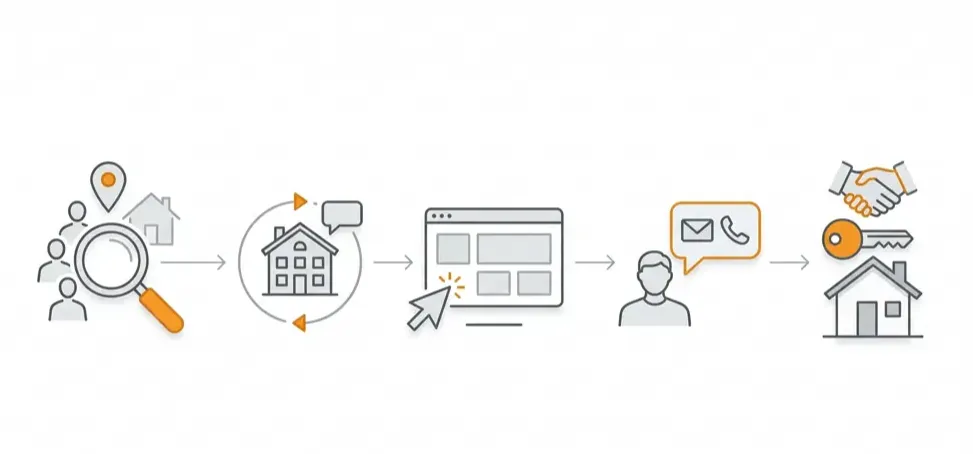
In this campaign, we used our proprietary Hot Demand System.
The idea behind it is simple.
First, we reach people who are already actively looking for real estate.
Then, we remind them about your development so they do not drift toward competing projects.
We have already tested this system across multiple developments, and we know it works.
It helps attract more qualified leads instead of wasting budget on people who were never likely to buy in the first place.
In practice, that means we are not trying to educate the entire market from scratch.
Instead, we capture existing demand and direct it toward a specific development.
Then we stay in front of the people who already showed interest but have not made a final decision yet.
That is the mechanism behind the results shown below.
What Happened in the First 30 Days
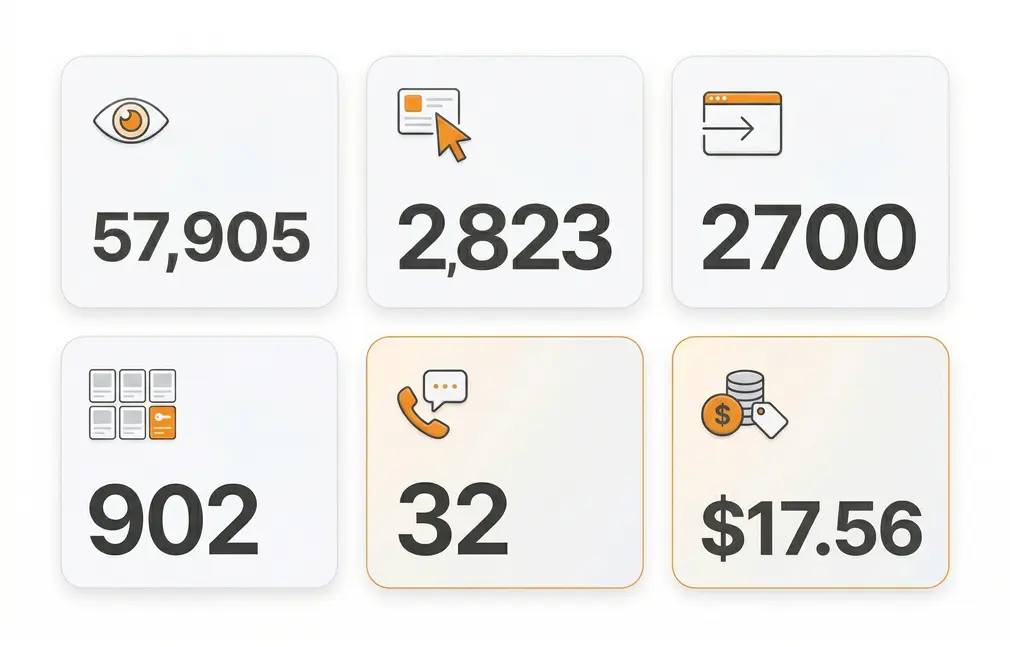
In March, the campaigns generated 57,905 ad impressions and 2,823 website visits from paid advertising.
The average cost per click came in at about $0.20, and the total ad spend was approximately $562.50.
The report also noted that part of the budget could not be used because of the payment card limit.
On the website itself, we recorded 2,700 visits, including 902 visits to individual home listing pages.
Users clicked the phone number 23 times and submitted 9 contact forms, which gave us a total of 32 leads.
That puts the average cost per lead at about $17.56.
1 Home Sold in the First Month
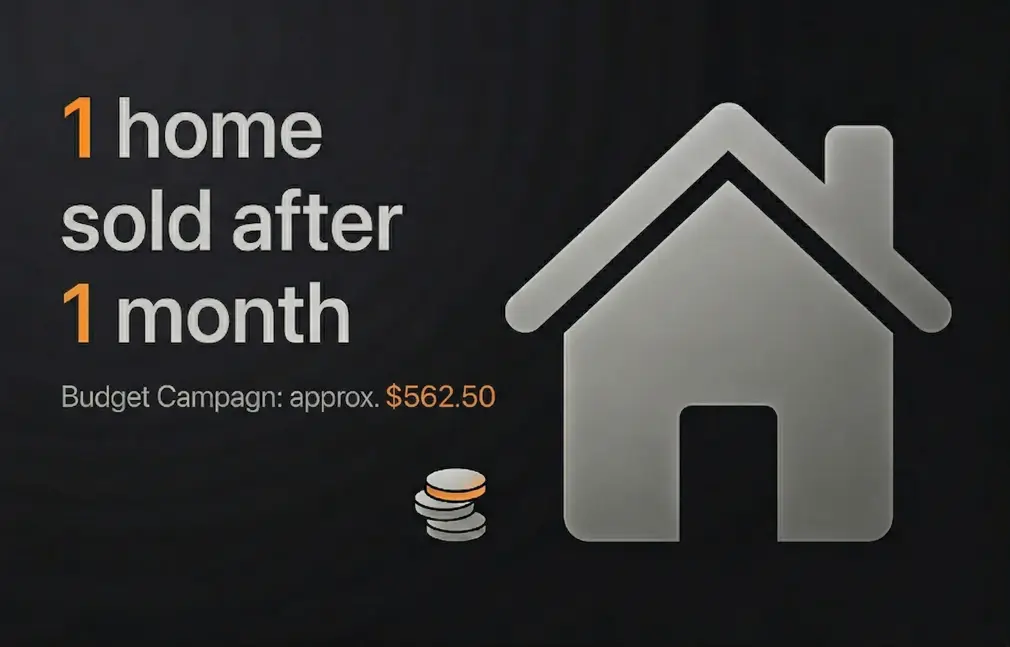
After the first month of campaign activity, with an ad spend of approximately $562.50, the campaign contributed to the sale of 1 home.
If we compare that with the 32 leads generated, we get a lead to sale conversion rate of roughly 3.1%, or simply 3%.
That is a strong signal.
Especially in real estate, where buying a home is not an impulse decision.
It is a longer process that usually involves comparison, conversations, and a high need for trust and confidence.
A Home Worth $184,750 Sold on an Ad Budget of Roughly $562.50
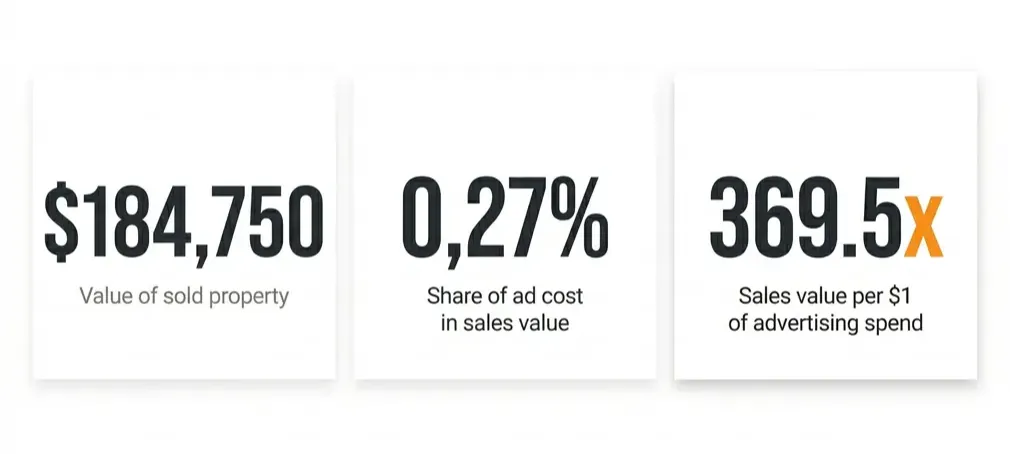
The strongest takeaway from the first month is simple.
A home valued at $184,750 sold while the total advertising budget was only about $562.50. That means the advertising cost represented only about 0.30% of the transaction value.
Put even more simply, the campaign delivered a 369x return relative to ad spend. In practical terms, that means every $1 invested in advertising was tied to about $369 in property value sold.
From a developer’s perspective, this is not just an interesting metric. It is a concrete business insight. It shows that well structured online marketing can represent only a tiny fraction of the transaction value while still having a real impact on sales.
Why This Result Is Even More Valuable Than It First Appears
There is another important layer of context here.
In this specific development, conversion is naturally slowed down by the stage of the project.
When homes are offered in presale, many buyers do not make a decision immediately.
A large portion of the market prefers to wait until the development is further along.
In many cases, buyers become much more ready to commit once the foundations are completed or visible construction progress is underway.
That means some of the traffic and some of the leads generated now are not only working toward current results.
They are also building future sales momentum.
The campaign is creating demand earlier than part of the market is ready to buy.
Because of that, the roughly 3% conversion rate after the first month should not be judged in isolation.
It is not a ceiling.
It is a sign that the campaign is already working, with room to improve further as the project progresses.
What Were Users Doing on the Website?
The report also revealed several strong signals about traffic quality.
The longest single visit lasted 2 hours and 20 minutes.
One user viewed 86 pages.
Another generated 131 clicks within the website.
In addition, 82% of users visited the site on a smartphone.
This matters for two reasons.
First, users were clearly engaging with the offer rather than bouncing after a few seconds.
Second, the project website must be designed primarily for mobile, because that is where most of the interaction is happening.
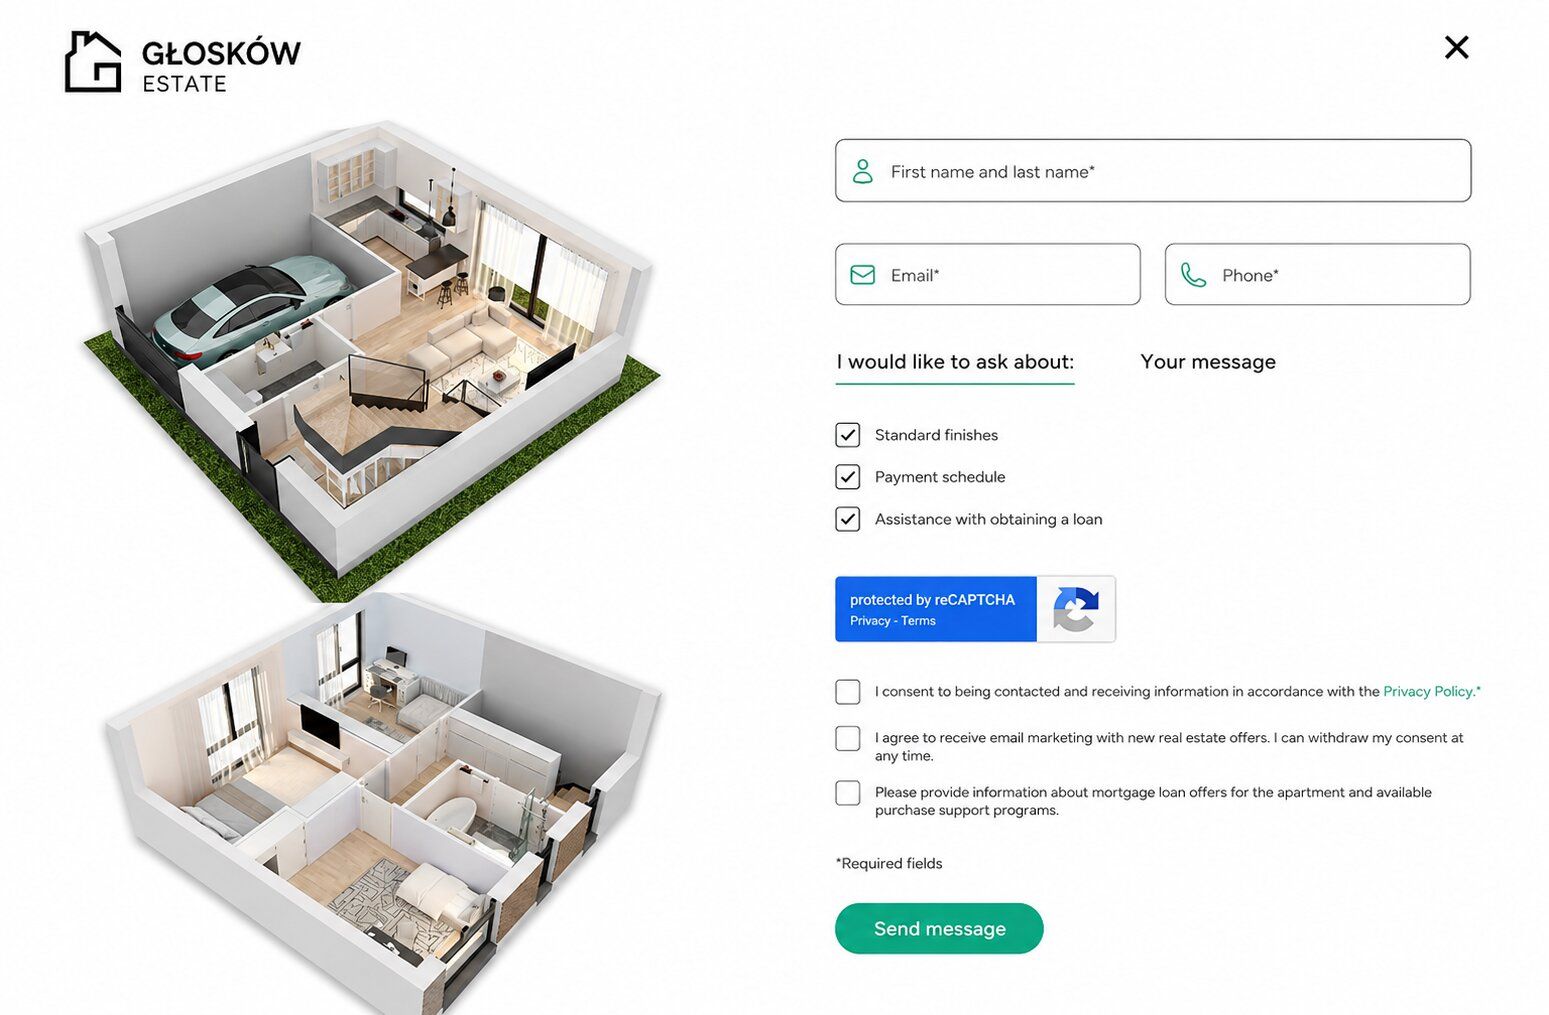
People Preferred Calling Over Filling Out Forms
One of the most interesting insights from the report was that nearly 72% of all leads came from phone number clicks.
That means users were much more likely to choose immediate contact over filling out a form.
For a real estate developer, that is extremely valuable.
It shows that for this type of project, the phone is one of the strongest buyer touchpoints.
In other words, the advertising and the website should not only collect form submissions.
They should also make immediate phone contact as easy as possible.
What Role Did Google Ads and Meta Ads Play?
In March, Google Ads generated 15,093 ad impressions, 1,622 website visits, and an average cost per click of about $0.21.
Meta Ads generated 12,147 ad impressions, 254 website visits, and an average cost per click of about $0.13.
Even after the first month, the pattern was clear.
Google Ads remained the primary sales channel because it attracted users with stronger buying intent.
Meta Ads played an important supporting role earlier in the funnel by building awareness around the development and helping re engage users later.
That combination fits perfectly with the Hot Demand System.
One channel captures people who are already looking.
The other helps bring them back at the right moment.
The Problem Was Not Quality. The Problem Was Scale
The report also showed that the issue was not campaign quality.
It was campaign scale.
Impression share and click share remained below 10%, which means competitors were still capturing a large portion of the demand in the market.
The conclusion from the report was very clear:
We were not losing in Google because of quality.
We were losing because of scale.
That matters because it tells us the campaign is already capable of producing results.
With a larger budget, it could capture a greater share of demand and turn that into more qualified leads and more sales.
Second month of the campaign. April. Could we scale it?
After the first month, we had a clear conclusion. The campaign had started working, but the problem was not the quality of the traffic. The problem was scale.
That is why in April we increased the ad budget to about $833 and expanded the campaign more aggressively. Google Ads remained the main sales channel because that is where we reach people actively searching for a home. Meta Ads, on the other hand, started working harder at an earlier stage, building interest in the development and feeding the top of the funnel.
The result?
In April, the campaigns generated 92,770 ad impressions, 4,397 website visits from ads, and the average cost per click dropped to about $0.19. The website itself recorded 4,800 visits, including 1,171 visits to specific unit pages.
This matters because increasing the budget does not always mean better results. Very often, when you scale a campaign, it starts becoming more expensive. Here, the opposite happened. The scale increased, and the average cost per click went down.
In other words, the campaign was not simply “pushed harder” with more budget. It started working more efficiently.
Google Ads remained the main sales channel
In March, Google Ads generated 15,093 ad impressions and 1,622 website visits. In April, that increased to 35,830 impressions and 3,191 website visits.
That means impressions increased by 137.4%, and website visits from Google Ads nearly doubled. Just as importantly, the average cost per click in Google dropped from about $0.22 to about $0.21.
This confirmed the earlier conclusion. Google Ads was not losing because of quality. It needed more scale to capture more real market demand.
And in real estate marketing, that matters a lot. A person searching on Google for terms related to buying a home is much closer to a buying decision than someone who randomly sees an ad while scrolling through social media.
That is why we continue to treat Google Ads as the main sales channel.
Meta Ads started building stronger interest
The biggest increase in scale, however, was visible in Meta Ads.
In March, Meta Ads generated 12,147 ad impressions and 254 website visits. In April, that increased to 56,970 impressions and 1,207 website visits.
That is a 369% increase in impressions and a 375.2% increase in website visits.
Why does this matter?
Because when selling homes, not every buyer makes a decision immediately. Very often, someone first sees the development, then comes back a few days later, compares the location, shows the offer to their family, checks the floor area, layout, price, and only then decides to make contact.
Meta Ads helps at exactly that earlier stage. It builds recognition for the development and makes users more likely to return to the offer instead of forgetting about it after the first interaction.
That is exactly why, after the first month, we increased the focus on TOFU campaigns. April showed that this direction made sense.
More people viewed specific homes
The number of website visits alone is not enough. In real estate sales, what matters much more is whether users go further and start analyzing specific offers.
In March, the unit pages had 902 visits. In April, they had 1,171 visits, which is almost 30% more.
That is a strong signal because it shows that traffic did not stop on the homepage. More and more users moved into specific units, checked the offer, and went deeper into the decision making process.
In practice, this means the campaign was not generating empty traffic. It was bringing in users who were genuinely interested in the available homes.
Clicks on “Ask for more information” more than doubled
One of the most important changes appeared around the “Ask for more information” button.
In March, users clicked it 14 times. In April, they clicked it 31 times. That is a 121% increase.
This is important because this button appears next to a specific unit. A user does not click it by accident. First, they need to enter the offer, check the unit, and only then take action.
In other words, more people were not only viewing the development. They were moving into a more serious contact stage.
Form submissions slightly decreased from 9 to 7, but we do not treat this as a drop in interest. The contact behavior changed. Users more often chose a faster path, either by clicking “Ask for more information” next to a specific unit or by calling directly from a Google Ads phone extension.
That is also valuable information for the real estate developer. Sometimes a buyer does not want to fill out a long form. They want to quickly ask about a specific unit, timeline, price, or availability.
So the easier we make that contact, the better.
Cost per contact dropped from about $18 to about $14
In March, the average cost per contact was around $18. In April, it dropped to about $14.
That is one of the strongest takeaways from the second month.
The campaign did not only generate more traffic. It also brought users to a contact action at a lower cost.
The average number of contacts increased from around 1 contact per day to almost 2 contacts per day. At the same time, one contact action happened every 83 website visits on average, compared to 84 visits in March.
This means that even with a larger traffic volume, the website maintained its effectiveness, and the cost of acquiring a contact went down.
From the real estate developer’s perspective, this is very important. The goal is not just to increase website traffic. The goal is to increase the number of valuable sales conversations at a reasonable cost.
Recognition of “Osiedle Głosków” continued to grow
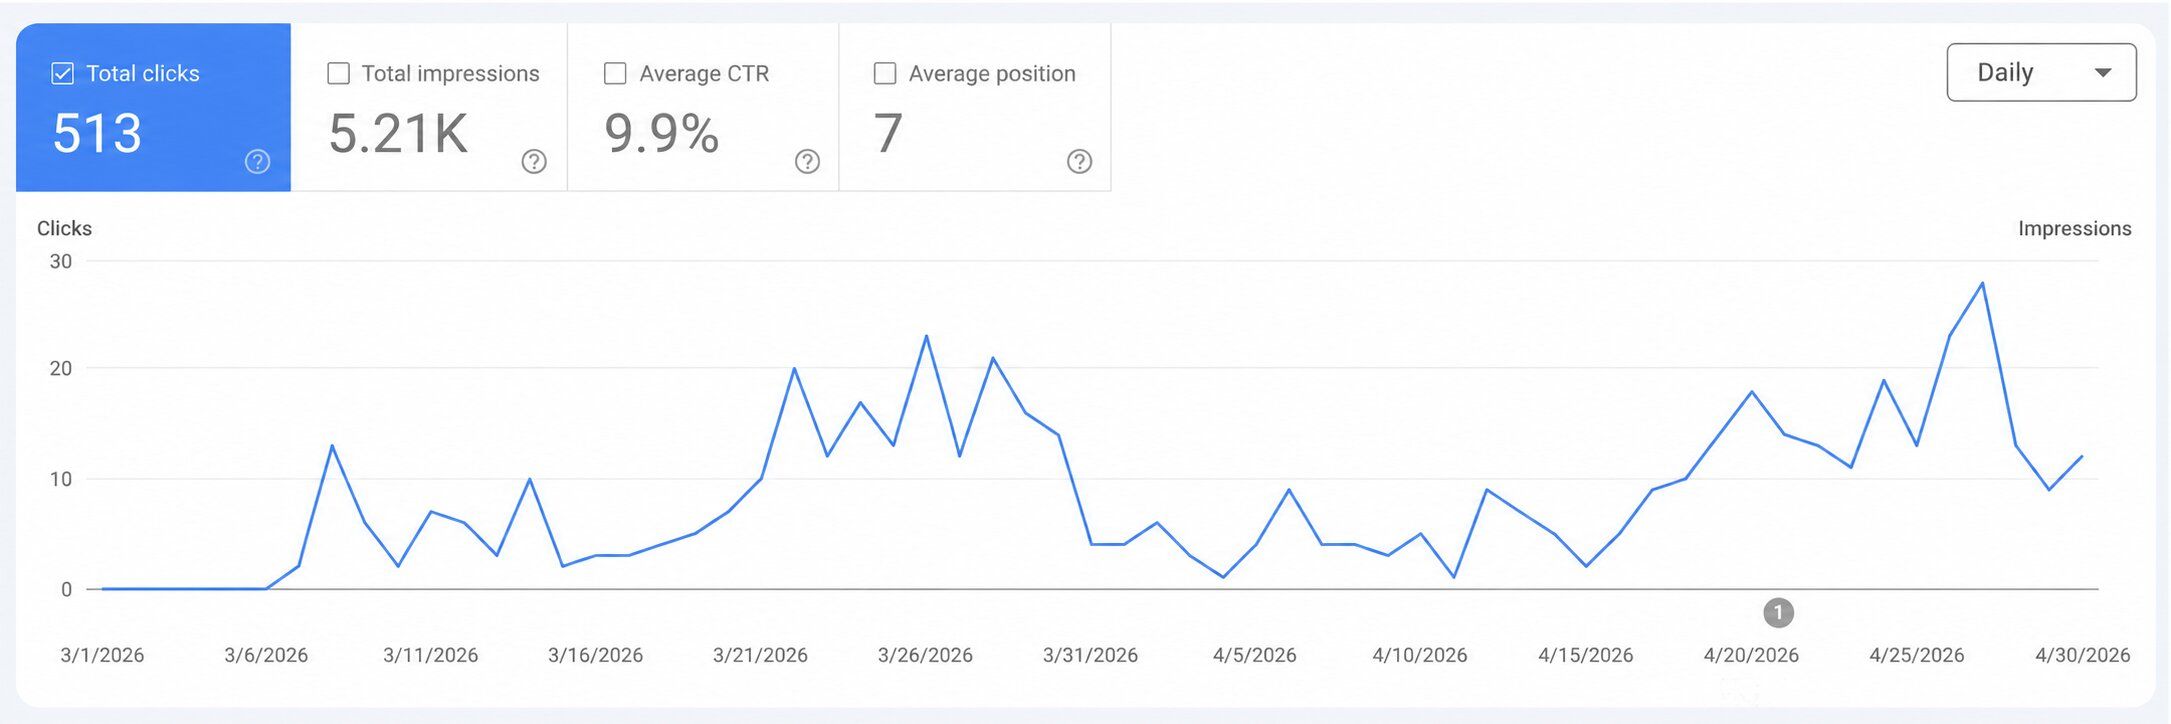
In March, the number of clicks from Google increased from 6 to 233. In April, it reached 278 clicks.
This shows that the development’s brand started working harder.
For real estate projects, this matters because users often do not make a decision immediately. First, they see an ad. Then they remember the name of the development. Later, they come back through Google, compare it with other offers, and only then contact the sales office.
That is why the increase in Google searches and clicks is not just an additional statistic. It is a signal that the development is becoming more recognizable in the local market.
What did the second month show?
April confirmed that the March result was not a one time accident.
In the first month, the campaign generated traffic, 32 contacts, and the sale of 1 home. In the second month, we managed to scale the campaign, lower the average cost per click, lower the cost per contact, and generate more visits to specific unit pages.
The main conclusion is simple.
In March, we tested whether the campaign could work. In April, we tested whether it could scale.
And the data showed that it could.
What happens after April?
After the second month, the direction was clear. The results showed that increasing scale and putting more emphasis on TOFU improved performance, so the client decided to double the monthly ad budget from about $833 to about $1,667.
This is an important decision because the campaign was no longer an unproven test. March showed that the campaign could generate traffic, contacts, and sales. April showed that the system could scale without losing efficiency. That is why May is the next stage of entering the market more aggressively.
Google Ads remains the main sales channel because it brings in traffic with the highest buying intent. Meta Ads will continue to build recognition for the development and feed the top of the funnel.
In May, we are also adding more TOFU creatives alongside the ones that have already won. We are not turning off the best performing ads. We are adding new graphic and video variations to test more messages and continue scaling without lowering traffic quality.
First, we brought valuable traffic to the website. Then we saw that this traffic could turn into contacts and sales. Now, after the client’s decision to increase the budget, the goal is to capture an even larger share of market demand.
The Last Month of Promotion: May
The assumption was simple. We would increase the budget to PLN 6,000 per month and check whether the Hot Demand System would continue to deliver not only website visits, but above all user behavior that is closer to a buying decision.
In the end, the advertising budget spent in May was PLN 5,698.21. This means we used practically the entire planned budget and were able to test the campaign at a clearly larger scale than in March and April.
It was an important moment because in real estate advertising, the goal is not just to increase spending.
The real question is different.
After increasing the budget, are we still attracting the right users? Are people only clicking the ads, or are they actually viewing the units? Is the campaign building interest that can turn into contact and sales?
May gave us many concrete answers to these questions.
What Happened in May?
In May, the campaigns generated 127,795 ad impressions and 7,995 ad clicks to the website. The average cost per click was PLN 0.71.
The website recorded 5,840 visits. This means the development continued to gain visibility and attract more users.
But another result was even more important.
The pages of specific units received 2,074 visits.
This matters a lot because when selling homes, a visit to the homepage alone does not tell the whole story. A user can enter the website, look at the first section, and leave. That is only the beginning of contact with the development.
What matters much more is whether they go further. Whether they check specific units. Whether they view layouts, square footage, prices, and availability. Whether they begin analyzing the offer the way a person seriously considering a purchase would.
In May, there were more of these behaviors.
And that is one of the most important signals from the third month of the campaign.
May Without a Sale. Why Is This Still an Important Result?
In May, no additional home was sold.
And it is worth saying that directly because good marketing is not about showing only the data that looks best.
Real estate sales do not work like an online store. A customer does not see an ad for a home worth several hundred thousand zloty and buy it after a few minutes. It is usually a longer process. Especially with homes in pre-sale, where some people wait for further construction progress, compare locations, talk with family, check financing, and return to the offer later.
That is why May was not a month of another sale.
It was a month of checking whether a larger budget would continue to feed the sales funnel.
And here the answer is positive.
The scale of advertising increased, the number of ad clicks increased, website visits increased, interest in specific units increased, and additional contact actions appeared.
This means the campaign did not start generating empty traffic after the budget increase. It continued to move users toward the offer.
And when selling homes, that matters a lot.
More People Viewed Specific Units
Visits to the development’s unit pages
The most important signal of traffic quality in May was the number of visits to the unit pages.
In May, users visited the unit pages 2,074 times.
This shows that people coming to the website did not stop at the general description of the development. More and more often, they went deeper and checked specific homes.
For a developer, this is very valuable information.
A person who views the homepage may still be at the stage of general interest. A person who enters a specific unit page is already closer to a decision. They begin comparing the layout, square footage, yard, price, and availability.
This is the moment when marketing starts moving from interest to real purchase consideration.
That is why in campaigns for real estate developments, we do not look only at the number of clicks.
We look at what the user does after entering the website.
In May, users increasingly did exactly what a potential buyer should do. They checked the units.
Contacts in May. Less Impressive Than a Sale, but Still Concrete
In May, we recorded 3 clicks on the phone number and 4 submitted forms. In total, this gave us 7 contacts counted as concrete contact actions.
This is not a result that can be described as spectacular when separated from the entire campaign. And that is exactly why it needs to be understood properly.
May was not a month in which a larger budget automatically turned into another transaction. It was a month that showed how the market behaves at a larger scale of activity.
And the market behavior was clear.
More people saw the ads. More people went to the website. More people viewed specific units. Some users completed a contact action. At the same time, the sale did not close within that same month.
That is normal in real estate.
When buying a home, a customer often needs several visits, several conversations, and time to make a decision. One person can enter the website today, return a week later, show the offer to their family, check financing, and only then call.
That is why in these kinds of campaigns, you cannot look only at the result of one month. You have to look at the entire process.
And in May, that process continued to work.
New and Returning Users. The Customer Does Not Always Decide Right Away
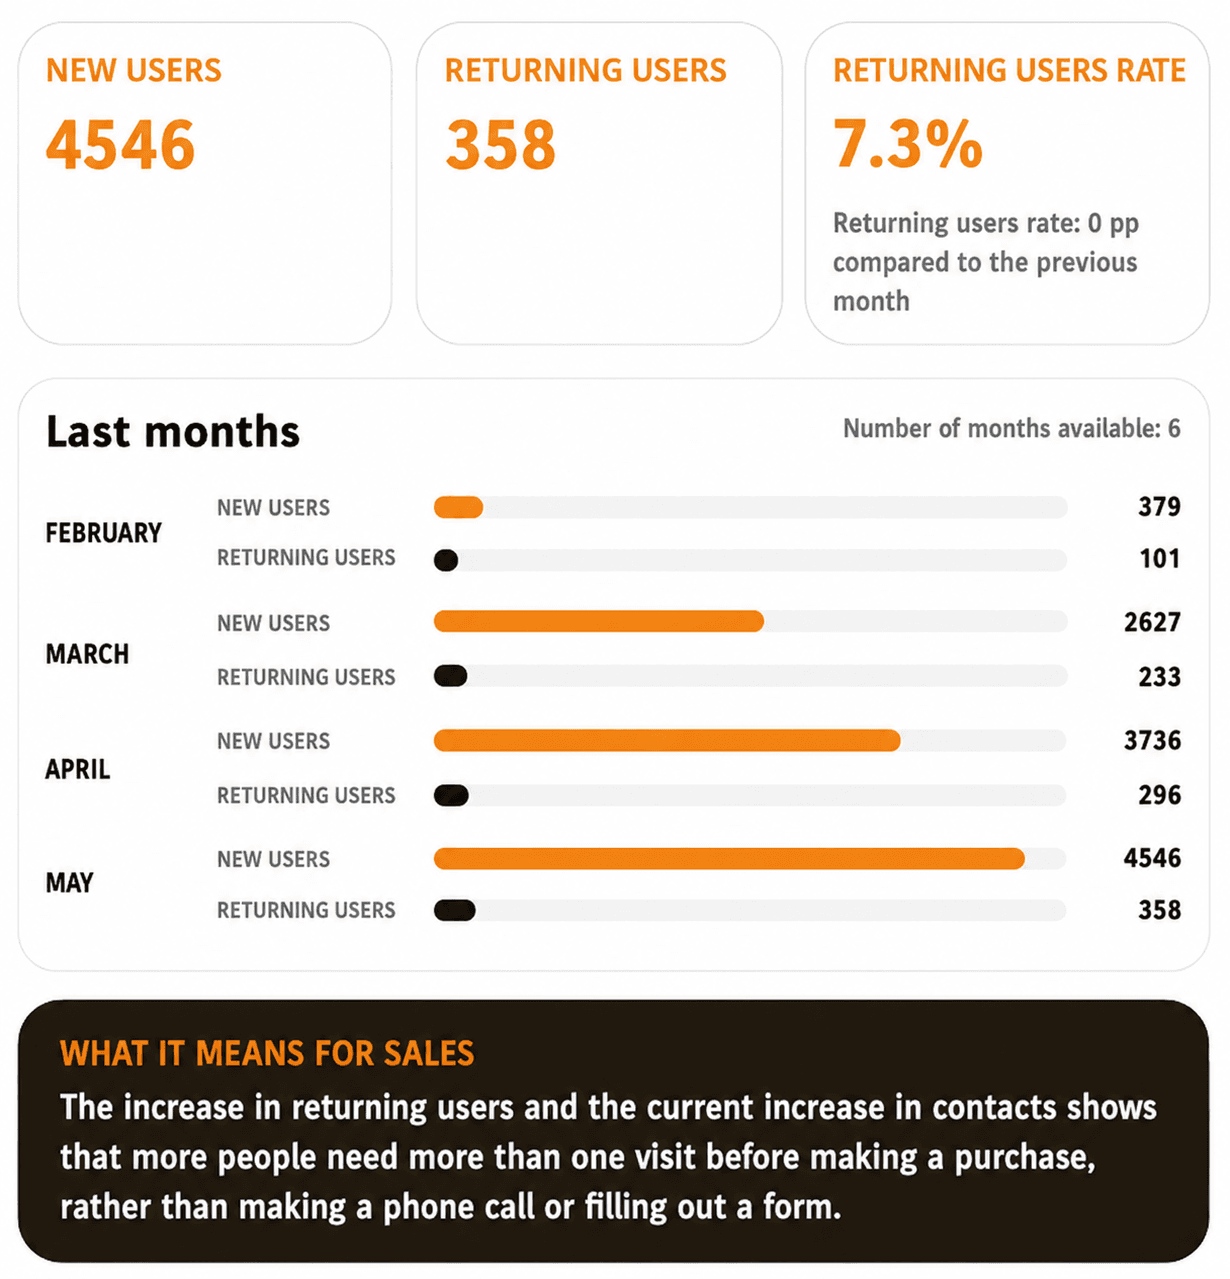
Returning users of a real estate development
In May, the website recorded 4,546 new users and 358 returning users.
This is very important context.
In real estate, a decision rarely happens after one visit. A user often first discovers the development, then returns to it after a few days, compares it with other offers, and only then makes contact.
That is why returning users matter.
They show that some people did not just randomly see an ad, but came back to the development. And a return visit is often a stronger signal than the first visit.
The first visit can mean curiosity.
A return means the offer stayed in the person’s mind.
And that is exactly what the Hot Demand System is about. Not just a one-time click, but keeping the development in the minds of people who may realistically be in the market.
Recognition of the Development Also Grew Beyond Ads
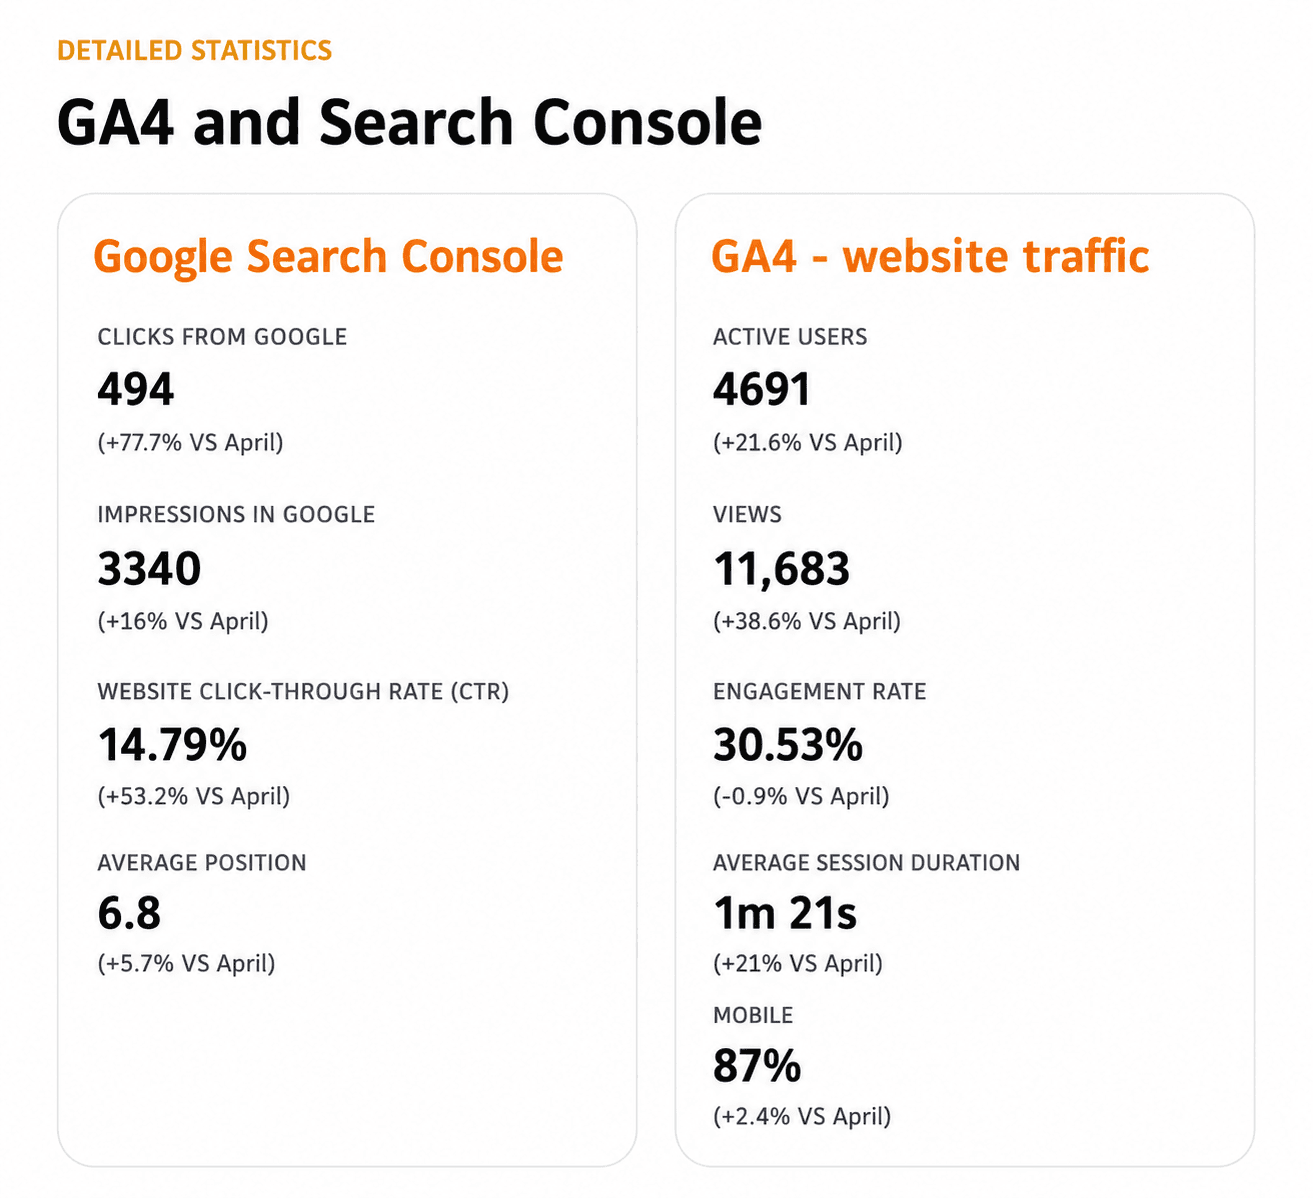
In May, the website recorded 494 free clicks from Google.
This is a very important signal because advertising does not work only at the moment of the click.
Some people see the ad, remember the name of the development, and later return to it through Google. Sometimes after a few hours. Sometimes after a few days. Sometimes only after talking with family.
That is why an increase in organic visits can be a side effect of a well-run paid campaign.
The user may not click on the ad again. They may simply type the name of the development into the search engine and return to the website from Google results.
For a developer, this is a very valuable situation.
It means the development is starting to exist in the awareness of the local market. It is not just another ad that someone scrolls past on their phone. It starts becoming a name the user recognizes and knows how to return to.
What Did May Show?
Conclusions from the third month of the campaign
May showed several very important things.
First, increasing the budget allowed us to move into a much larger scale. The campaigns generated 127,795 impressions and 7,995 ad clicks.
Second, the traffic did not stop on the homepage. Users increasingly moved to specific unit pages, and the number of visits to unit pages exceeded 2,000.
Third, the “Ask for more information” button started playing an important role in the contact path.
Fourth, there was no sale in May, but that does not mean the campaign stopped working. In home sales, some effects appear with a delay because the buying decision takes time.
Fifth, the May data confirmed that Google Ads and Meta Ads should continue working together because they support different stages of the customer decision process.
And sixth, mobile must be treated as the main contact path because the vast majority of traffic comes from phones.
Scale Compared to the Competition Was Still the Problem
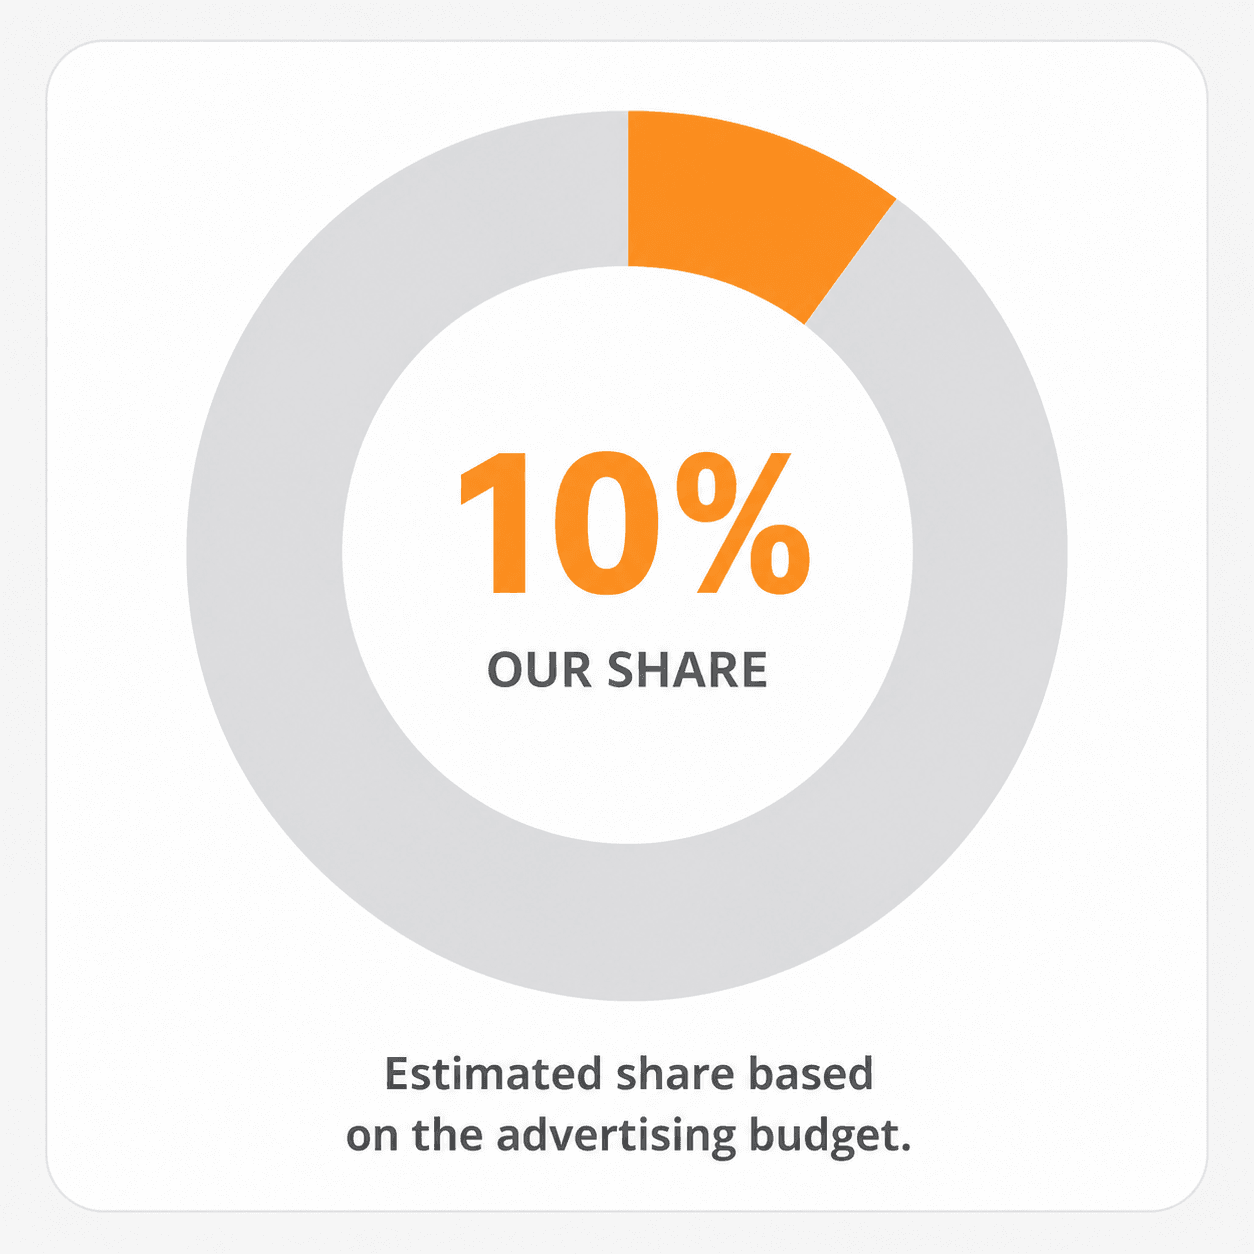
May also showed something that had already been visible before.
We were not losing because of ad quality. The main limitation was still scale.
Our campaign’s share of visibility in Google Ads was around 10 percent. This means that most of the potential visibility was still outside our budget reach or belonged to competitors.
This is a very important conclusion.
If competitors are working with much larger budgets, optimization alone is not enough to immediately take over the entire market. You can have a well-configured campaign, well-matched ads, and a solid website, but if your visibility share is limited, some of the demand will still pass you by.
That is why further growth requires two things.
First, more scale where the cost per click and the quality of traffic make sense.
Second, an even better website path so that a larger share of users moves from viewing the offer to making contact.
This is not about one magic setting inside the advertising account. It is a process.
What Comes After May?
After May, the direction was clear.
We are not turning the campaign upside down because the data did not show that the system broke. Quite the opposite. It showed that with a larger budget, traffic, interest in units, and recognition of the development continue to grow.
That is why in the next month, we need to strengthen what works.
Google Ads should continue capturing users who are closer to a decision, meaning those actively searching for a home, a location, or a specific development.
Meta Ads should continue building recognition, feeding the top of the funnel, and reminding people about the offer if they have already visited the website or viewed specific units.
Remarketing should continue working on people who visited the website but have not yet made contact.
On the website, we need to continue strengthening mobile, the visible phone number, the form, and the “Ask for more information” button next to the units.
Because a campaign does not end with a click.
The click is only the entry point into the process.
Summary After Three Months
After three months of activity, we can already see a fuller picture.
In March, we launched the campaign and checked whether we could bring valuable traffic to the website. The effect appeared quickly. There were visits, contacts, and the sale of 1 home.
In April, we checked whether the campaign could be scaled. Increasing the budget brought more visits, more interest in units, and a lower average cost per contact.
In May, we moved to an even higher budget. We assumed PLN 6,000, and in the end we spent PLN 5,698.21. There was no sale that month, but the campaign continued to increase the development’s visibility, website traffic, visits to unit pages, and recognition in Google.
This shows that marketing for a real estate development needs to be evaluated as a system, not as a single ad.
One ad does not sell a home.
The system is supposed to make the right person see the development, return to it, check a specific unit, feel that the offer fits their needs, and make contact.
Only then does the sales conversation begin.
What Is the Hot Demand System in Practice?
The Hot Demand System is based on a simple assumption.
We are not trying to convince the entire market from scratch.
First, we reach people who are already closer to a decision or are realistically considering buying real estate. Then we remind them about the development before they move to a competitor. Next, we direct them to the website, where they can check the specific offer and make contact.
In practice, this system consists of several elements.
The first element is Google Ads, meaning capturing people with intent. These are people who are searching for something. A home. A location. A development. An alternative to an apartment. They are the closest to a decision, which is why this channel is so important.
The second element is Meta Ads, meaning building awareness and interest. This channel helps show the development to people who may be in the target group, but are not necessarily searching for it at that exact second.
The third element is remarketing. If someone visited the website, viewed units, or returned to the development, they should not disappear from the system. They should see more messages that remind them about the offer and encourage them to return.
The fourth element is the development website. Advertising is not enough if, after clicking, the user lands on a website that does not lead them to the next step. The website must present the offer clearly, especially on mobile. It must lead users to specific units and make it easy to contact the sales team.
The fifth element is measuring behavior. We do not look only at impressions and clicks. We look at visits, unit page visits, phone clicks, forms, returning users, and actions connected to specific offers.
Only the combination of these elements creates a system.
Not a single campaign.
Not random traffic.
Not advertising for reach alone.
A process that is supposed to lead the right people from their first contact with the development to a conversation with the sales office.
The Most Important Conclusion From the Entire Test
The most important conclusion after three months is simple.
In real estate marketing, the winner is not the one with the prettiest ad.
The winner is the one who can connect demand, visibility, the website, remarketing, and contact into one system.
Osiedle Głosków was a good example of this approach.
First, we brought valuable traffic to the website. Then we started increasing scale. Next, we checked how the system behaved with a larger budget. Along the way, we saw a sale, contacts, growing recognition, increasing interest in units, and a clear signal that mobile has to be treated as the main contact path.
That is exactly the point of the Hot Demand System.
It is not about clicks.
It is not about reach for the sake of reach.
It is about making the development visible to the right people at the right moment and giving the user a simple path from interest to contact.
And when selling homes, that often makes the difference betw